Matplotlib Example
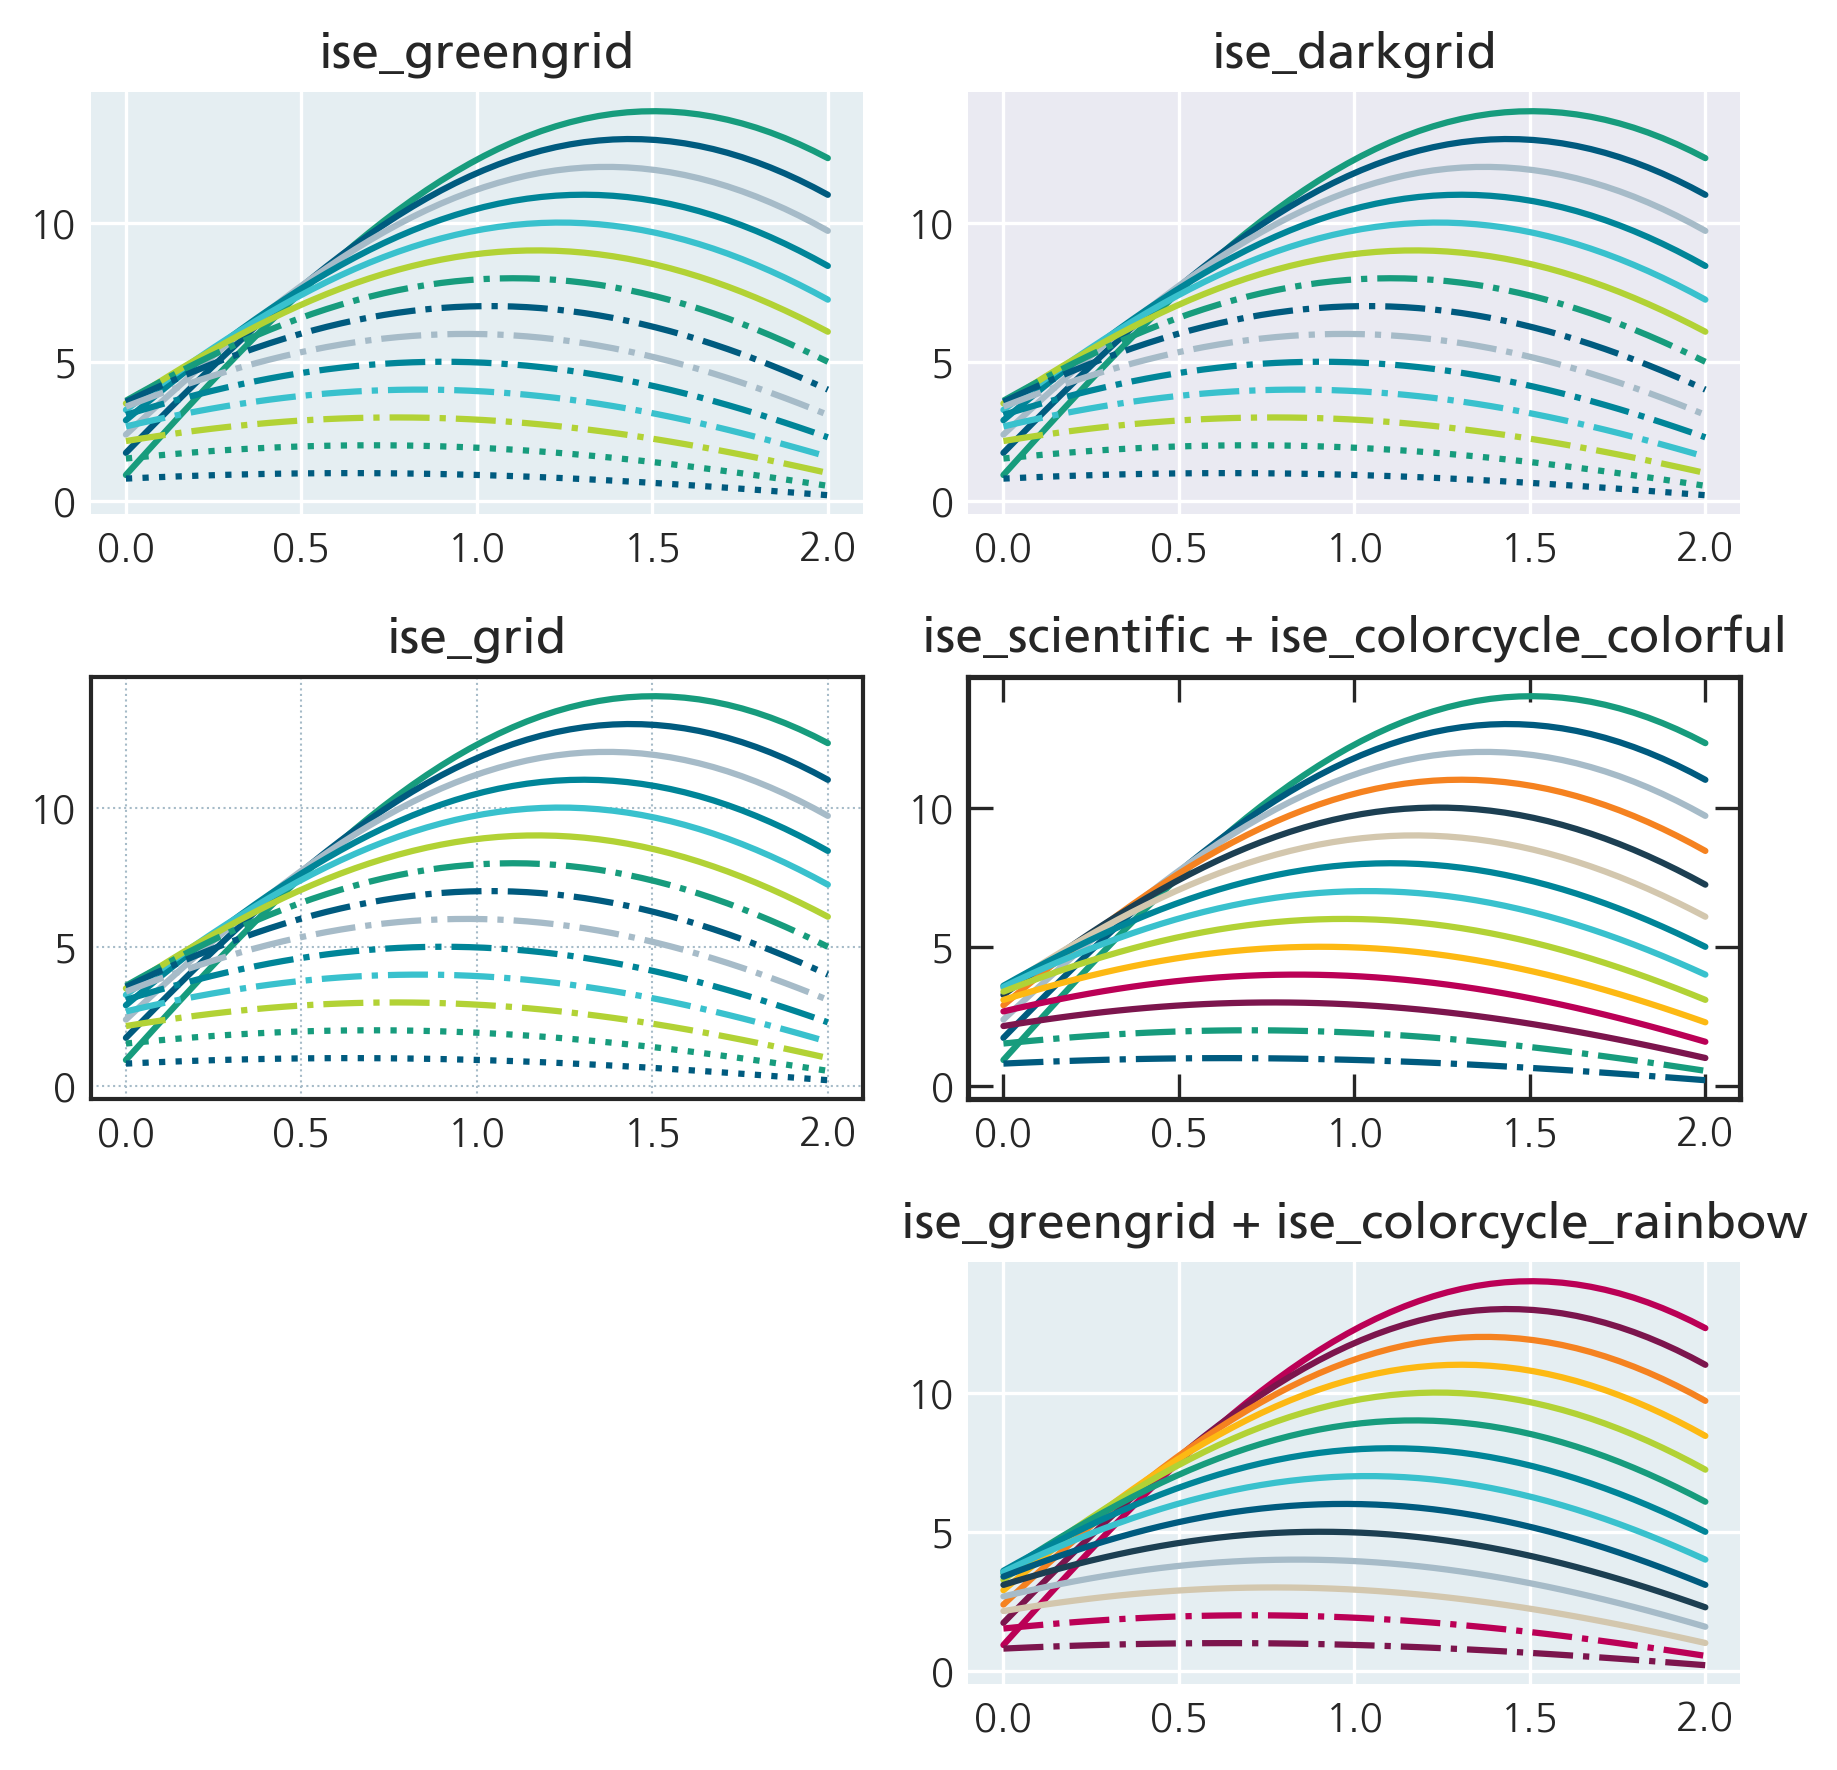
This example demonstrates how to create plots in Fraunhofer coporate design using Matplotlib. In Matplotlib first template needs to be set with “set_matplotlib_style()” and then the plot can be generated.
# -*- coding: utf-8 -*-
"""
Created on Mon Apr 24 2025

@author: pgebhard, cwolff
"""
import os
import sys
import numpy as np
import matplotlib.pyplot as plt
current_dir = os.path.dirname(os.path.abspath(__file__))
sys.path.append(os.path.join(current_dir, "../src"))
import fhgcd_plots.main as fhgCD


def sinplot():
    x = np.linspace(0, 2, 50)
    many = 15
    for i in range(1, many):
        plt.plot(x, np.sin(x + i * 1/many) * (many - i))

f = plt.figure(figsize=(6, 6))
gs = f.add_gridspec(3, 2)

fhgCD.set_matplotlib_style("greengrid")
ax = f.add_subplot(gs[0, 0])
plt.title("ise_greengrid")
sinplot()


fhgCD.set_matplotlib_style("darkgrid")
ax = f.add_subplot(gs[0, 1])
plt.title("ise_darkgrid")
sinplot()

fhgCD.set_matplotlib_style("grid")

ax = f.add_subplot(gs[1, 0])
plt.title("ise_grid")
sinplot()

fhgCD.set_matplotlib_style("scientific", "colorful")
ax = f.add_subplot(gs[1, 1])
plt.title("ise_scientific + ise_colorcycle_colorful")
sinplot()

fhgCD.set_matplotlib_style("greengrid", "rainbow")
ax = f.add_subplot(gs[2, 1])
plt.title("ise_greengrid + ise_colorcycle_rainbow")
sinplot()

f.tight_layout()
plt.savefig("test")