Plotly Example
This example demonstrates how to create plots in Fraunhofer coporate design using Plotly. In plotly graph objects first the figure needs to be generated and afterwards the function “fig.update_layout(template = fhgCD.get_plotly_template(style, color_cycle))” needs to be run. In plotly express the template needs to be specified when creating the plot with “px.scatter(df, template=fhgCD.get_plotly_template(“scientific”, “colorful”))”.
"""
Created on Tue Mai 20 2025
@author: cwolff
"""
import os
import sys
import numpy as np
import plotly.graph_objects as go
import plotly.express as px
current_dir = os.path.dirname(os.path.abspath(__file__))
sys.path.append(os.path.join(current_dir, "../src"))
import fhgcd_plots.main as fhgCD
###################
# Plotly go example
###################
def create_plot(title, style, color_cycle):
"""Creates and styles a Plotly plot.
Args:
title (str): Title of the plot.
style (str): Style for the plot.
color_cycle (str): Color cycle for the plot.
Returns:
Plotly figure: Styled Plotly figure.
"""
def sinplot(many=15):
x = np.linspace(0, 2, 50)
return [
go.Scatter(
x=x,
y=np.sin(x + i * 1/many) * (many - i),
mode='lines',
name=f'Sin Wave {i}'
) for i in range(1, many)
]
fig = go.Figure(data=sinplot())
fig.update_layout(title=title)
# Set corporate design
fig.update_layout(template = fhgCD.get_plotly_template(style, color_cycle))
return fig
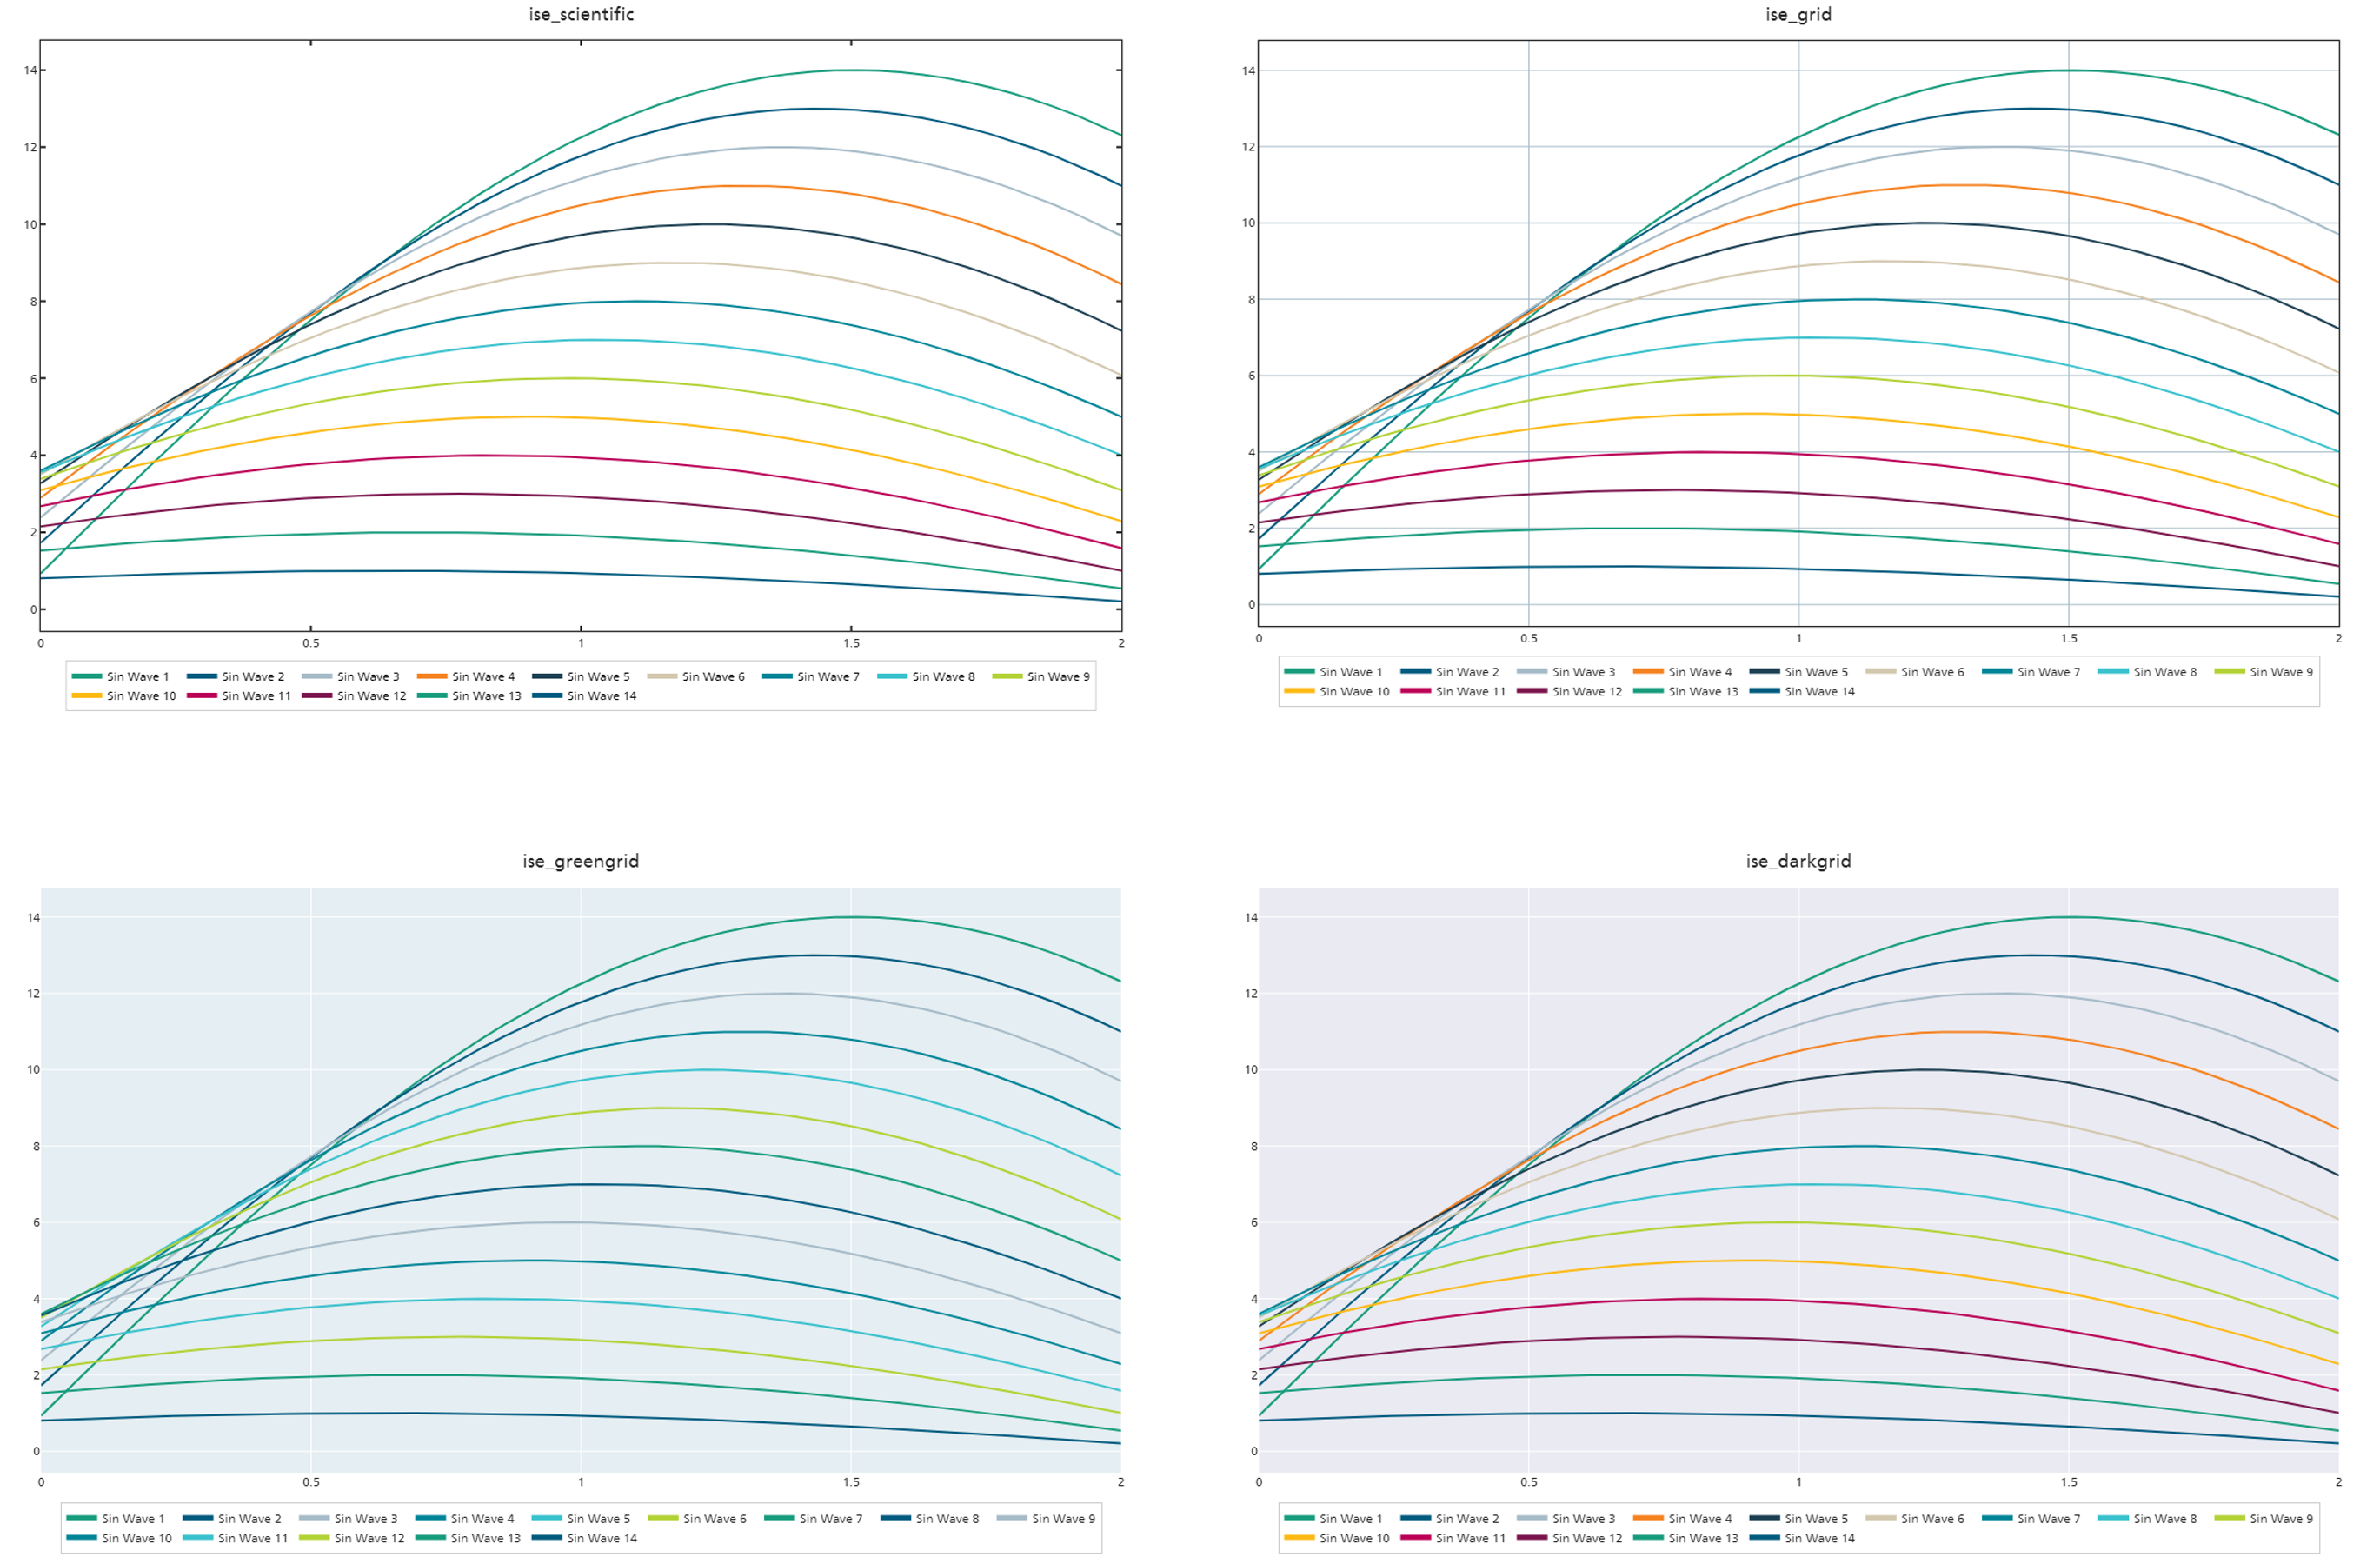
# Create and display plots with different styles
styles = [
("ise_greengrid", "greengrid", "official"),
("ise_darkgrid", "darkgrid", "colorful"),
("ise_scientific", "scientific", "colorful"),
("ise_grid", "grid", "rainbow")
]
for title, style, color_cycle in styles:
fig = create_plot(title, style, color_cycle)
fig.show()
###################
# Plotly px example
###################
# Generate Plot
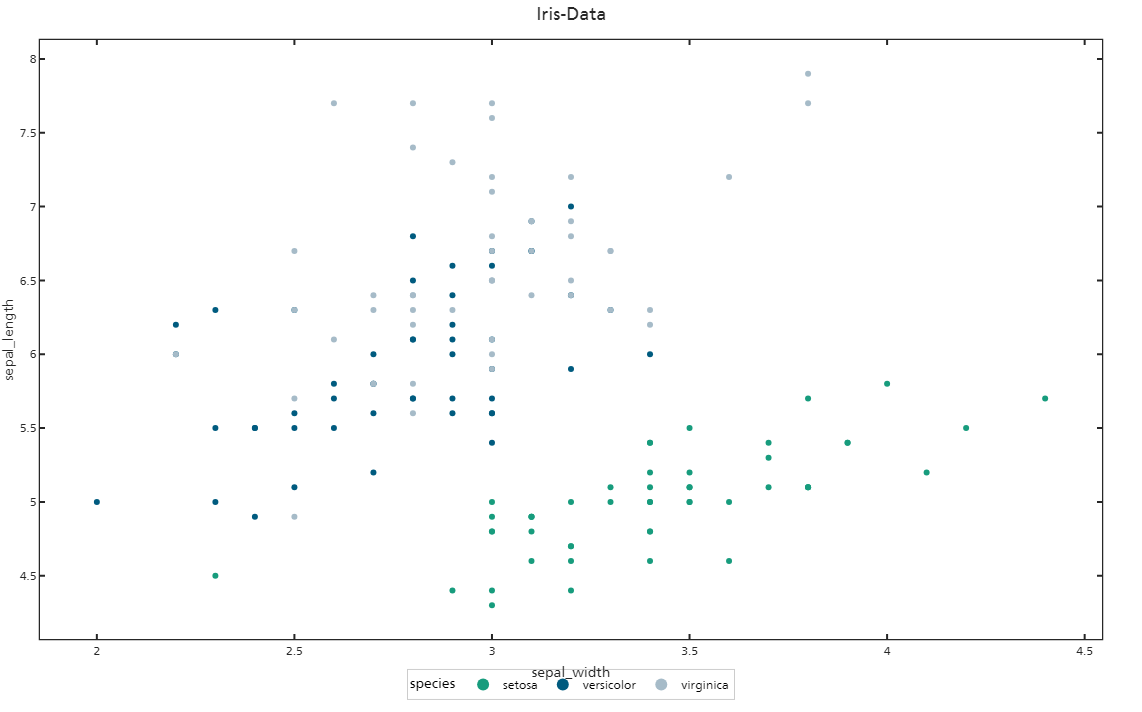
df = px.data.iris()
# The template needs to be specified while generating the plot
fig = px.scatter(df, template=fhgCD.get_plotly_template("scientific", "colorful"), x='sepal_width', y='sepal_length', color='species', title='Iris-Data')
fig.show()
Plotly px